What's next for rates? The 2-year Treasury is flashing a warning
For decades, bond market practitioners have relied on a deceptively simple rule of thumb: the 2-year US Treasury yield tells you where the Fed funds rate needs to go. It is not perfect, but it has a remarkable track record. And right now, it is sending a message that markets cannot afford to ignore.
The 2-year as a policy compass
Look at the chart below. Between 2023 and 2025, the spread between the 2-year Treasury and the Fed funds rate was persistently negative, meaning the market was pricing rates lower than where the Fed was holding them. The bond market was telling the Fed it was too tight. The Fed eventually agreed and cut rates three times in the second half of 2025.
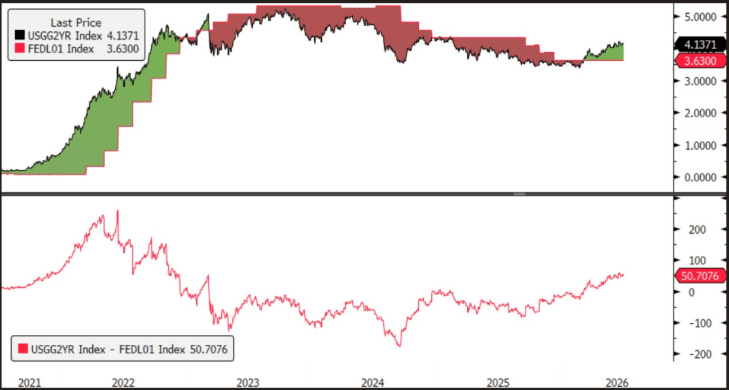
The situation today is the mirror image. The 2-year Treasury is currently 4.14%, against a Fed funds rate of 3.63%, a positive spread of approximately 50 basis points. If history is any guide, the bond market is now signaling that the Fed may need to hike rates by roughly 50 basis points, or two quarter-point moves, from here.
A Fed at an Inflection Point
June's FOMC meeting, Kevin Warsh's first as Chair, delivered a much more hawkish message than markets had anticipated, significantly reducing expectations for near-term rate cuts. While the Fed kept rates unchanged at 3.50%–3.75%, the dot plot turned notably more hawkish, with 9 of 18 participants now projecting at least one rate hike this year, a sharp shift from March, when rate cuts remained in the base case.
Markets are now pricing two hikes by year-end based on Fed Funds futures, Bank of America expects three consecutive 25bps hikes in September, October, and December, while Deutsche Bank sees two. JPMorgan remains the outlier, holding rates steady through 2026. Not all signals point in the same direction, however. Brent crude has fallen below its pre-conflict level as tensions in the Middle East have eased, reducing a key source of inflationary pressure. Meanwhile, June non-farm payrolls disappointed at 57,000, well below the 115,000 consensus, with prior months also revised lower.
Perhaps the most notable takeaway from Warsh's first meeting was his decision not to submit a dot, consistent with his long-standing skepticism of forward guidance. By withholding a personal rate of projection, Warsh has left markets with greater uncertainty over the future policy path, reinforcing the view that the Fed's decisions will be increasingly data dependent.
The next key pivot point will be the upcoming inflation print. A stronger-than-expected reading would likely cement expectations for a September rate hike.
Generic Market View
The June NFP miss and falling oil prices offer a brief reprieve, but the direction of travel is becoming clear, the dot plot has flipped, Wall Street has repriced, and the 2-year Treasury is pointing higher. Markets are pricing two hikes; Bank of America sees three. Outcome may hinge on the next inflation print. Expect near-term volatility, with the next decisive move in markets dependent on whether inflation gives the Fed permission to pause or force its hand.
Sources: Bureau of Labor Statistics (June 2026); Federal Reserve FOMC Summary of Economic Projections, June 2026; CME FedWatch Tool; Bank of America Research (June 2026); Deutsche Bank Research; BLS Employment Situation Summary, July 2026, Fundstrat, Bloomberg.
RESEARCH AND MARKET COMMENTARY DISCLAIMER
*For Professional Clients only
Geojit Private Wealth (DIFC) Limited [Regulated by DFSA]
N401, 4th Floor, Emirates Financial Towers, DIFC, UAE


Latest Blogs
VIEW ALL
Earnings Are King in 2026
By Ankit Kapoor, CFA, FRM, Deputy Chief Investment Officer, Geojit Private Wealth (DIFC)
Read More
The Fed's New Inflation Yardstick - And Why It Matters
By Ankit Kapoor, CFA, FRM, Deputy Chief Investment Officer, Geojit Private Wealth (DIFC)
Read More
From Monza to Markets – The Art of a Timely Exit
Curated investment solutions across public and private markets, selected to support disciplined portfolio construction.
Read More